spectrogram
前回の枕で紹介した、歩行姿勢チェックシステム、要になってるのは、 キネクトのセンサー。 こいつ自身にプロセッサーを内蔵させて処理の大半を行わせる事により、相手側(通常はXBox)の負荷を下げるとか。
いずれにしろ、素人が考えても、膨大な演算を行ってる事は予想出来る。
Xboxしかり、ソニーのプレステしかり、GPGPUを搭載して、ポリゴンの処理を任せているんだな。GPGPUと言えば、ビットコインの採掘で膨大な計算資源が必要になり、グラボに目をつけられたな。今は下火になったんで、ゲーマー用PCを自作する人はほっとしてるでしょう。
GPGPUは計算に特化したやつ。そんなの身近にあるぞってんで、 Raspberry PiのGPUで行列乗算(その1)をやってる方がいる。
Raspberry PiのGPUで数値計算: (2)QPUの特徴
面白そうだね。
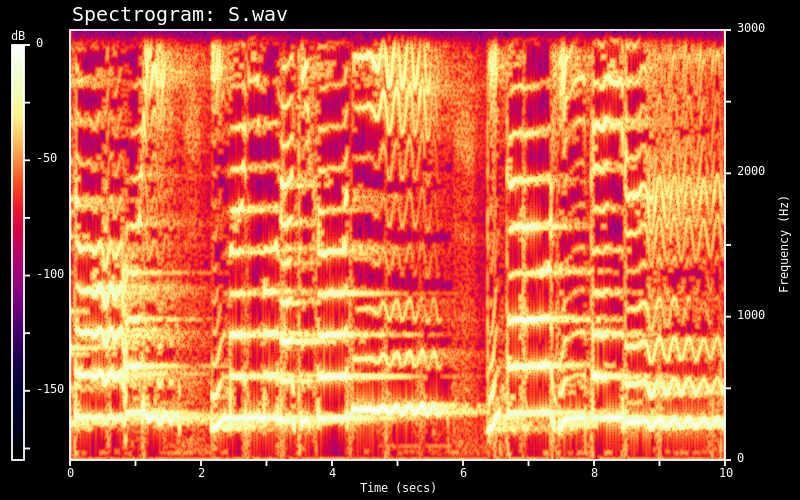
spectrogram of sox
前回最後で、soxもうやらないって大見得切ったのに、また登場した。ソース見てたらfftが出てきてたから。ちょいとgdbにかけてみた次第。
使う素材は以前にも出て来たカラオケCDのやつから、下記のように切り出した。
sakae@usvr:/tmp$ sox ~/WAV/16.wav S.wav trim 20 10 remix 2 rate 6k
sakae@usvr:/tmp$ gdb -q sox
Reading symbols from sox...done.
(gdb) b lsx_rdft
Function "lsx_rdft" not defined.
Make breakpoint pending on future shared library load? (y or [n]) y
Breakpoint 1 (lsx_rdft) pending.
(gdb) r S.wav -n spectrogram
Starting program: /home/sakae/MINE/bin/sox S.wav -n spectrogram
[Thread debugging using libthread_db enabled]
Using host libthread_db library "/lib/x86_64-linux-gnu/libthread_db.so.1".

Breakpoint 1, lsx_rdft (n=1024, isgn=1, a=0x555555773170, ip=0x5555557a38e0,
    w=0x5555557a3930) at fft4g.c:347
warning: Source file is more recent than executable.
347         nw = ip[0];
最初はstartの中から呼ばれてる。計算に必要なsinの値を用意する為だ。
(gdb) source bt.py
#0 lsx_rdft(...)  fft4g.c:347
#1 lsx_safe_rdft(...)  effects_i_dsp.c:219
#2 start(...)  spectrogram.c:269
#3 sox_add_effect(...)  effects.c:157
#4 add_effect(...)  sox.c:708
#5 add_effects(...)  sox.c:1073
#6 process(...)  sox.c:1759
#7 main(...)  sox.c:3008
(gdb) c
Continuing.

Breakpoint 1, lsx_rdft (n=1024, isgn=1, a=0x555555773170, ip=0x5555557a38e0,
    w=0x5555557a3930) at fft4g.c:347
347         nw = ip[0];
(gdb) source bt.py
#0 lsx_rdft(...)  fft4g.c:347
#1 lsx_safe_rdft(...)  effects_i_dsp.c:219
#2 flow(...)  spectrogram.c:349
#3 flow_effect(...)  effects.c:257
#4 sox_flow_effects(...)  effects.c:449
#5 process(...)  sox.c:1802
#6 main(...)  sox.c:3008
二回目からは、実際にデータが流れてくるflowの中から呼ばれている。1024ポイントのfftって事が分かる。
fftのルーチンは、外から借用されたもの。 fft4g.cに英語向けの案内があったけど、あえて日本語(EUC-JP)をあげる。
汎用 FFT (高速 フーリエ/コサイン/サイン 変換) パッケージ
FFT (高速フーリエ・コサイン・サイン変換) の概略と設計法
このライブラリは、SET@homeにも使われているとか。日本からOSS界への貢献ですな。さすが、京大。
sakae@usvr:~/sox-14.4.2/src$ grep rdft -l *.c
dft_filter.c
effects_i_dsp.c
fft4g.c
firfit.c
loudness.c
rate.c
spectrogram.c
vad.c
一応、どんな所で活躍してるか確認。rateって、サンプリングレートの変換だな。FFTした後で、高域のスペクトラグラムをZEROにしてから、逆変換すればサンプリングレートを容易に変換出来るって事? ソース嫁。
vadって何かと思ったら、
       vad [options]
              Voice  Activity  Detector.   Attempts  to trim silence and quiet
              background sounds from the ends of (fairly high resolution  i.e.
              16-bit, 44-48kHz) recordings of speech.  The algorithm currently
              uses a simple cepstral power measurement to detect voice,
信号の有る無しをパワースペクトラムで検出してるんだな。ノイズリミッターも高級志向? 無線機もそうなってたりして。どうでっしゃろ >ICOM殿。
spek
spectrogramを書いてくれる物が他に無いか、探してみたよ。まず引っかかってきたのが下記。
Spek – Acoustic Spectrum Analyser
GUI版しか無いのは、いかがなものかと思う。どうせ結果はpngとかになるはずなんで、その表示 ルーチンを抱えてしまうのは、汎用性を潰してしまうと思うのよ。
案内が出てたので、行ってみたよ。 Short-time Fourier transform あの人の好きな数式がしっかり並んでいた。
sndfile-tools
次に見つけたのがこれ。
sakae@usvr:/tmp/sndfile-tools-1.04$ ls -l bin
total 140
-rwxrwxr-x 1 sakae sakae 18112 Jun  7 05:50 sndfile-generate-chirp*
-rwxrwxr-x 1 sakae sakae 13288 Jun  7 05:50 sndfile-mix-to-mono*
-rwxrwxr-x 1 sakae sakae 18056 Jun  7 05:50 sndfile-resample*
-rwxrwxr-x 1 sakae sakae 37432 Jun  7 05:50 sndfile-spectrogram*
-rwxrwxr-x 1 sakae sakae 44760 Jun  7 05:50 sndfile-waveform*
ソースを取ってきて、コンパイルしてみた。
sakae@usvr:/tmp/sndfile-tools-1.04/bin$ ./sndfile-spectragram

Usage :

    sndfile-spectragram [options] <sound file> <img width> <img height> <png name>

    Create a spectrogram as a PNG file from a given sound file. The
    spectrogram image will be of the given width and height.

    Options:
        --dyn-range=<number>   : Dynamic range (default is 180 for 180dB range)
        --no-border            : Drop the border, scales, heat map and title
        --min-freq=<number>    : Set the minimum frequency in the output
        --max-freq=<number>    : Set the maximum frequency in the output
        --fft-freq=<number>    : Set the lowest resolvable frequency and the
                                 height of each band in the linear spectrogram.
                                 Lower values increase frequency resolution but
                                 smear the output horizontally and higher values
                                 improve the temporal definition but decrease the
                                 distinction between the lowest frequencies.
        --log-freq             : Use a logarithmic frquency scale
        --gray-scale           : Output gray pixels instead of a heat map
        --kaiser               : Use a Kaiser window function (the default)
        --rectangular          : Use a rectangular window function
        --nuttall              : Use a Nuttall window function
        --hann                 : Use a Hann window function
気になるFFTはどうしてるかと思ったら、FFTW3にさらりと任せていた。 データサイズを2のべき乗にしなくても良いって言う特徴を生かして、表示(png作成)の都合に合わせて、トップダウンでサイズを決めている。
と言う事でFFTの部分はあっさりしてるんだけど、pngの作図でcairoが出てきたりして、そっちの方が大変そうだったよ。
        spec->plan = fftw_plan_r2r_1d (2 * speclen, spec->time_domain, spec->freq_domain, FFTW_R2HC, FFTW_MEASURE | FFTW_PRESERVE_INPUT) ;

        fftw_execute (spec->plan) ;

        /* Convert from FFTW's "half complex" format to an array of magnitudes.
        ** In HC format, the values are stored:
        ** r0, r1, r2 ... r(n/2), i(n+1)/2-1 .. i2, i1
        **/
        max = spec->mag_spec [0] = fabs (spec->freq_domain [0]) ;

        for (k = 1 ; k < spec->speclen ; k++)
        {       double re = spec->freq_domain [k] ;
                double im = spec->freq_domain [freqlen - k] ;
                spec->mag_spec [k] = sqrt (re * re + im * im) ;
                max = MAX (max, spec->mag_spec [k]) ;
                } ;
絵に書いた餅じゃしょうがないので、走らせて図を表示してみる。
sakae@usvr:/tmp$ ./sndfile-spectrogram S.wav 800 500 bySndT.png
sakae@usvr:/tmp$ gpicview bySndT.png
結果はsoxと一緒だな。
by scipy
Windows10のupdateで、いよいよpythonが簡単にインストール出来るようになるらしい。志有る人ならとっくの昔に入れていると思うんだけどな。python軍団から強力な押しがあったんでしょう。色々と協力しますよと。
そんな訳なんで、オイラーも心機一転、CentOSにanaconda3を入れてみた。 Minicondaの方が良かったかな。
いえね、色々やろうとすると、コンパイラーも必要になるっしょ。Windowsではそんな事避けたいからね。 VisualStudio2019Communityなんて大嫌いだ。
python王国は3.4Gの敷地を持つ広大なものだった。色々なサービスがてんこ盛りになってるんだな。Windowsに入れても、裸では使い物にならず、結局anaconda3とかのご厄介になるのだろうな。
pythonでスペクトラグラムって叫んだら、色々と出て来た。
scipyで周波数解析(FFT)の時間変化可視化(スペクトログラム)
初心者なので、なぞってみる事にした。
(base) cent:tmp$ sox S.wav s.dat
;; and remove comment line
(base) cent:tmp$ cat s.dat | awk '{printf("%s,%s\n", $1,$2)}' >data.CSV
データはCSVで必要らしいので、上記のように加工した。そんなのpythonでサクッとやれってのは、ご勘弁。なんせpythonの初心者ですから。
# -*- coding: utf-8 -*
import numpy as np
import matplotlib.pyplot as plt
from scipy import fftpack
from scipy import signal

plt.close('all')
in_f = u"data.CSV"
(time, data) = np.loadtxt(in_f,unpack=True, delimiter=",",usecols = (0,1))

fs = 6000.0 # smpling freq
f,t,Sxx = signal.spectrogram(data, fs, nperseg=256)

plt.figure()
plt.pcolormesh(t,f,Sxx,vmax=1e-6)
plt.xlim([0,10])
plt.xlabel(u"Time [sec]")
plt.ylabel(u"Freq [Hz]")
plt.colorbar()
plt.show()
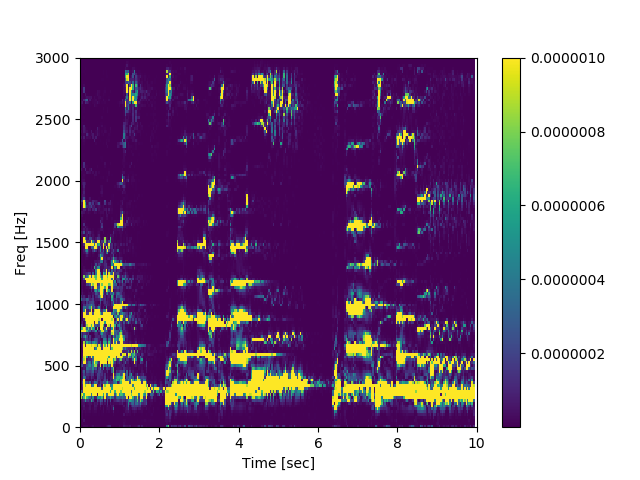
by matplotlib
【python】スペクトログラムを表示【サウンドプログラミング】
#coding:utf-8

import scipy.io.wavfile as wio
import matplotlib.pyplot as plt


if __name__ == '__main__':
    rate, data = wio.read("S.wav")
    pxx, freq, bins, t = plt.specgram(data,Fs = rate)
    plt.show()
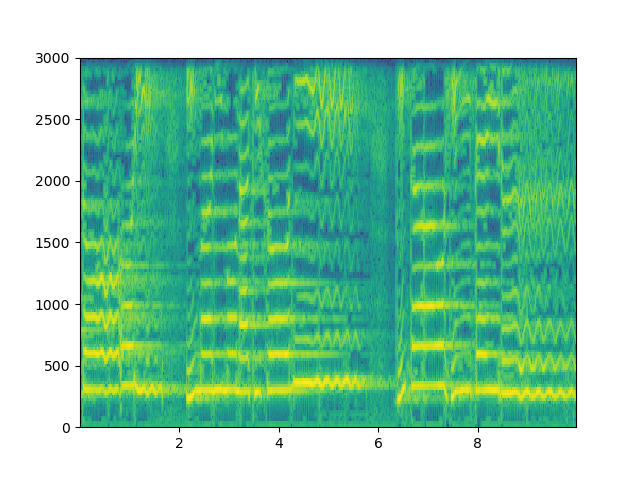
by numpy
これ、SFTPの原理が説明されてて、かつそれがコードで示されているので、大いに参考になる。
そして、一般的な扱い方法も。みんなでよってたかって、あれこれと書いてくれるので、嬉しい事です。
こちらは、SFTPの集大成になるかな。python簡単って事です。
M-x pdb
簡単ついでに、 python用のdebuggerをemacs上から使うには、上記のようにするとな。普通pdbってコマンドがPATHに居ないので、
;; for M-x pdb
(setq gud-pdb-command-name "python3 -m pdb")
こんな、逃げの手を打っておいて使う。
余りコピペだけじゃあれなんで、上記のfftから組み立てるやつを少々改変してみた。
#coding:utf-8
import numpy as np
import matplotlib.pyplot as plt
import scipy.io.wavfile as wio

sampling_rate, data = wio.read("S.wav")
NFFT = 1024
OVERLAP = NFFT // 2
frame_length = data.shape[0]
time_song = float(frame_length) / sampling_rate
time_unit = 1 / float(sampling_rate)

start = (NFFT / 2) * time_unit
stop = time_song
step =  (NFFT - OVERLAP) * time_unit
time_ruler = np.arange(start, stop, step)

window = np.hamming(NFFT)
spec = np.zeros([len(time_ruler), 1 + (NFFT // 2)])
pos = 0

for fft_index in range(len(time_ruler)):
    frame = data[pos:pos+NFFT]
    if len(frame) == NFFT:
        windowed = window * frame
        fft_result = np.fft.rfft(windowed)
        fft_data = np.log(np.abs(fft_result) ** 2)
        for i in range(len(spec[fft_index])):
            spec[fft_index][-i-1] = fft_data[i]
        pos += (NFFT - OVERLAP)

plt.imshow(spec.T, extent=[0, time_song, 0, sampling_rate/2], aspect="auto")
plt.xlabel("time[s]")
plt.ylabel("frequency[Hz]")
plt.colorbar()
plt.show()
python3用に修正してみた。何が違うって、割り算を / でやると、結果を浮動小数になっちゃう事。整数が欲しいなら、// とする事だ。世代間ギャップですな。
pdbを無理に使わなくても、これぐらいの長さのコードなら、ipythonを起動しておいて、
In [1]: run 'spect.py'

In [3]: fft_index
Out[3]: 116

In [4]: spec
Out[4]:
array([[ 7.68126067,  8.06846761,  7.92107505, ..., 10.65149394,
        17.22289612, 18.30745862],
         :
       [ 0.        ,  0.        ,  0.        , ...,  0.        ,
         0.        ,  0.        ]])

In [6]: help(np.arange)


In [7]: time_ruler
Out[7]:
array([0.08533333, 0.17066667, 0.256     , 0.34133333, 0.42666667,
       0.512     , 0.59733333, 0.68266667, 0.768     , 0.85333333,
          :
       9.472     , 9.55733333, 9.64266667, 9.728     , 9.81333333,
       9.89866667, 9.984     ])
こんな風に、残骸を調べてもいいな。
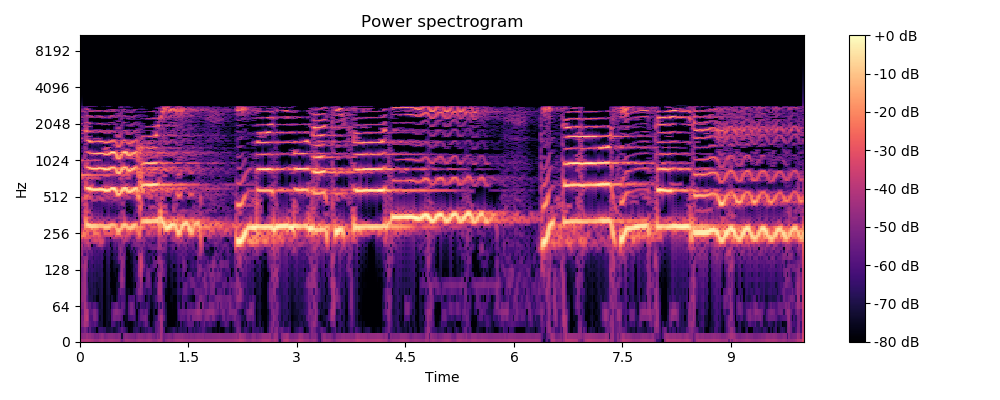
by librosa
音楽解析ライブラリlibrosaで津軽三味線をスペクトル解析してみた
こちらは、作成元の資料。どうも人工知能用を目指しているようだ。
conda config --add channels conda-forge
conda install ffmpeg
pip install ffmpy
ffmpegってのは、なかなか良さそうなので、上記のようにおまかせにした。
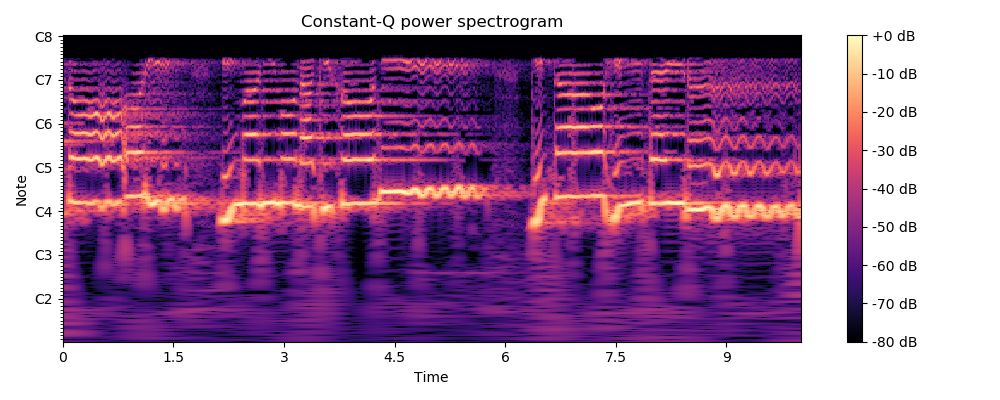
(base) cent:tmp$ google-chrome byCQ.png
(base) cent:tmp$ google-chrome /usr/local/share/emacs/26.1/etc/refcards/calccard.pdf
CentOSには、画像ビューワーのgpicviewが入っていない。そんな時は、上記のように万能ビューワーである、google-chromaを使えば良い。これ、生活の知恵だな。
ffmpeg
FFmpeg なんてのを知った。音と動画の編集の根幹を成す有名なOSSらしい。ユーチューバーも知らず知らずのうちに使ってるだろうね。
オイラーも使ってみるか? えっ、何時からそんな副業を始めたの。
(base) cent:tmp$ ffmpeg -i kato.wma ryo.wav
     :
Stream mapping:
  Stream #0:0 -> #0:0 (wmav2 (native) -> pcm_s16le (native))
Press [q] to stop, [?] for help
Output #0, wav, to 'ryo.wav':
  Metadata:
    INAM            : 知床旅情
    IART            : 加藤 登紀子
     :
Windowsの田舎フォーマットをPCMに変換。この手が有れば、わざわざWebにアップして変換するなんていう面倒がいらないな。